Grafana gcx and MCP go GA: telemetry for AI coding agents
Grafana has made gcx and its MCP server generally available, giving coding agents structured access to metrics, logs, alerts and dashboards.
- AUTHOR
- Karol Rapacz / CEO of Breachroad · OSCP · PNPT
- PUBLISHED
- 28 July 2026
- READING TIME
- 12 min read
- TOPIC
- AI Security
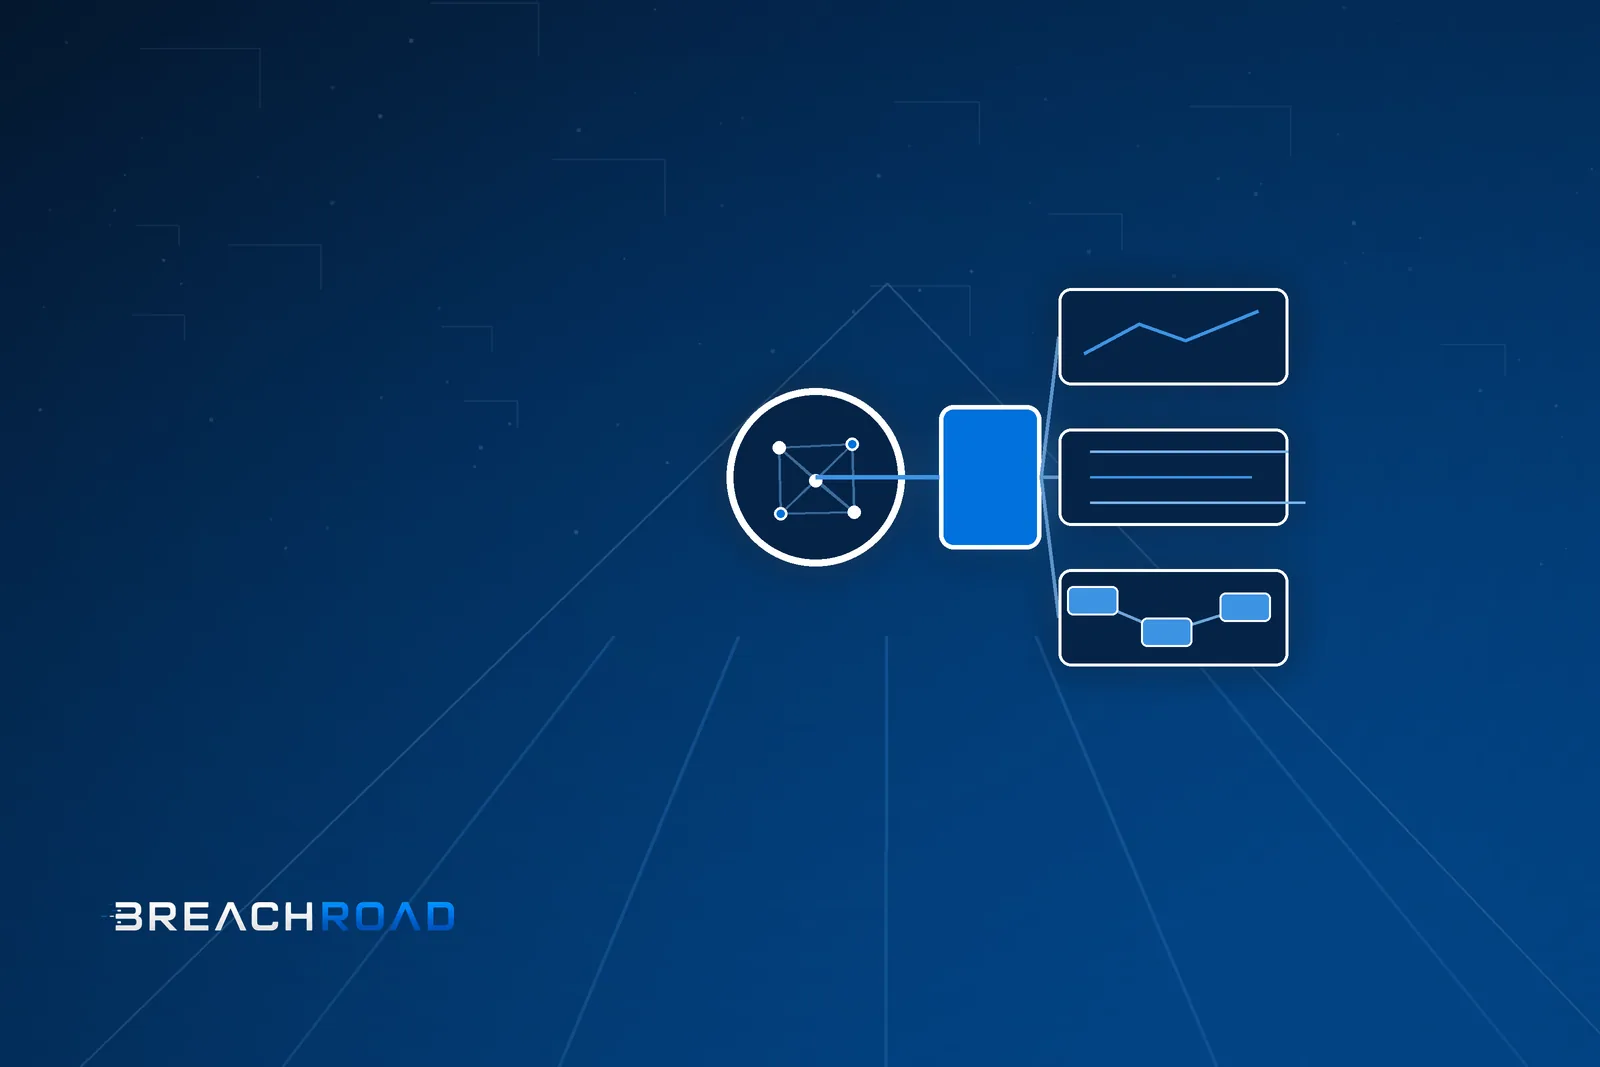
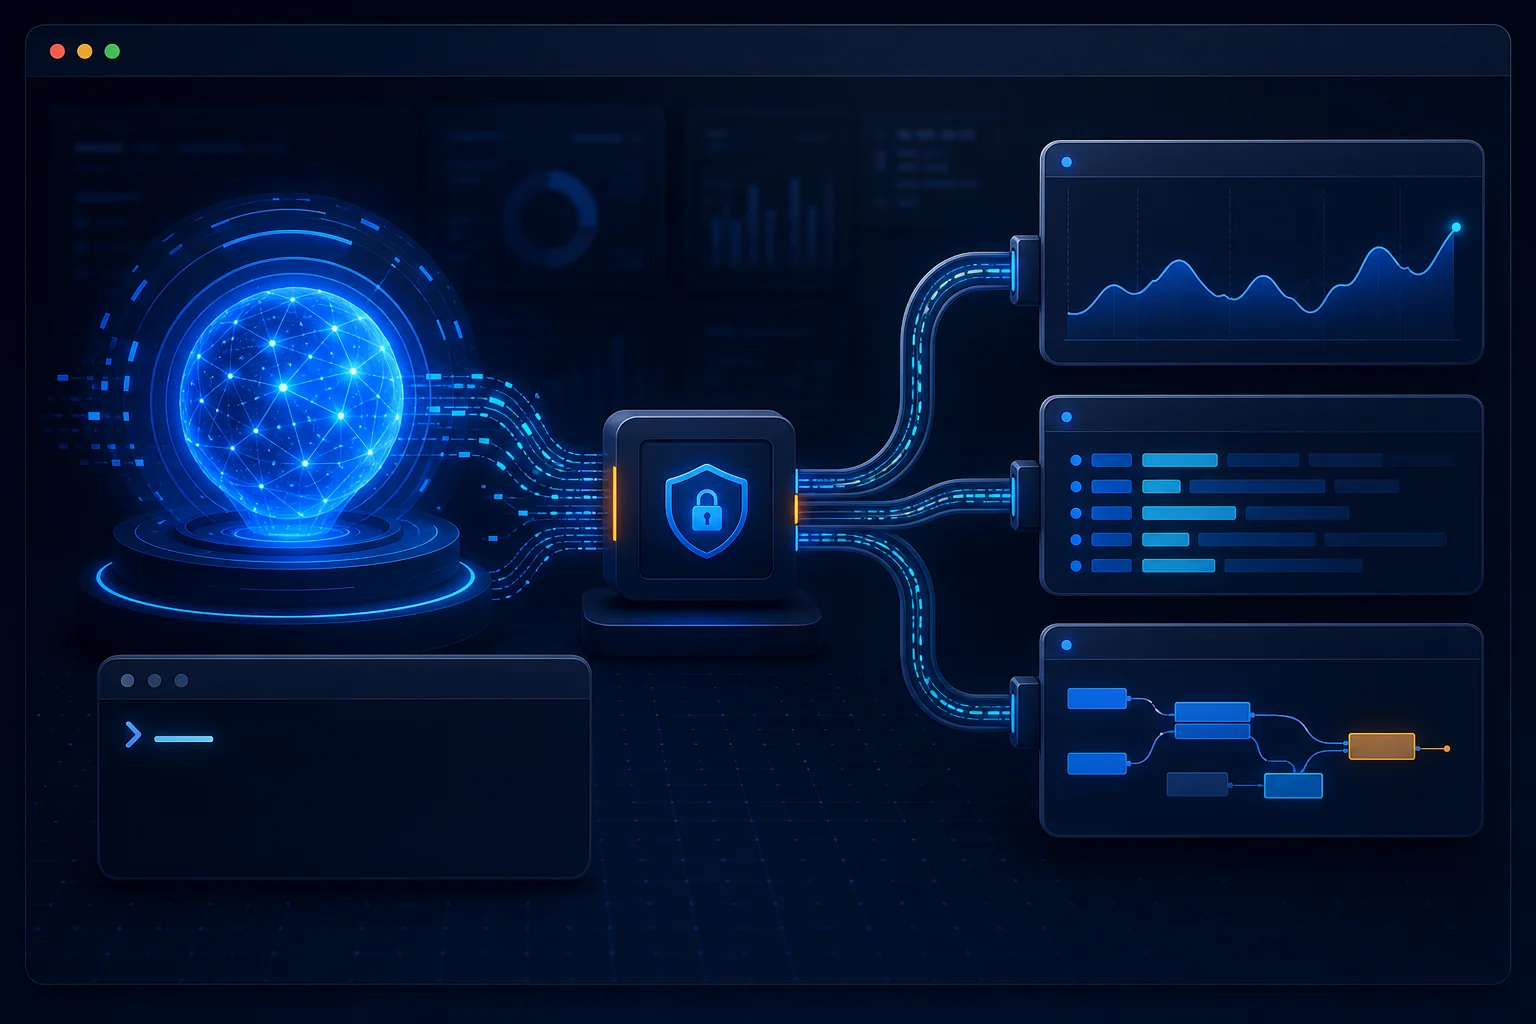
Grafana Labs announced the general availability (GA) of two tools designed to connect coding agents with observability on 28 July: Grafana CLI for AI agents (gcx) and Grafana MCP server. The direction matters more than the launch itself. An AI agent no longer has to work only from code and tests—it can receive controlled access to metrics, logs, traces, alerts and dashboards, then examine how its change behaves in a real system.
Grafana calls the model telemetry-driven development. Instead of declaring success after generating a patch, an agent can collect evidence: compare latency before and after a change, inspect errors under realistic load, read an SLO or evaluate a synthetic test. It is a promising step towards more accountable automation—provided that telemetry access does not become a back door into production.
What Grafana released
The two tools address a similar problem through different interfaces.
Grafana MCP server exposes a set of tools through the Model Context Protocol. Teams can self-host it or use a hosted service for Grafana Cloud. It is more opinionated: the agent receives operations designed for common tasks rather than constructing every API request from scratch.
gcx is a command-line interface designed for predictable machine use. It returns structured JSON or YAML and exposes stable exit codes and errors an agent can handle in a loop. It works with Grafana Cloud as well as self-hosted Grafana OSS and Enterprise version 12 and later.
The CLI covers resources including:
- dashboards and folders;
- alert rules;
- data sources;
- contexts that separate environments;
- Grafana Cloud products including Synthetic Monitoring, k6, Fleet Management, Incidents and Adaptive Telemetry.
In practice, an organisation might use MCP for common interactions inside an editor or agent and gcx for deterministic workflows, automation and GitOps. There is no need to select one mechanism for every use case.
Why coding agents need telemetry
An agent may understand local code but still know little about its operating environment. It can read the function handling a request without knowing whether the endpoint receives ten calls per minute or one hundred thousand per second. It does not know typical payload sizes, the latency distribution or which errors are already tolerated.
That creates an understanding gap: the rate at which changes are generated grows faster than a human team’s ability to understand their impact. More patches do not necessarily create more productivity when the team later spends its time fighting regressions.
Telemetry can narrow the gap. An agent handling a performance task might:
- read the baseline p95 and p99 for an endpoint;
- find traces for its slowest requests;
- correlate them with database queries and errors;
- prepare a change and a test;
- run load in an isolated environment;
- compare the result against the baseline and SLO limit;
- present a human reviewer with the patch and the evidence.
That is a stronger contract than “make the API faster.” Success becomes measurable and the result can be reproduced.
MCP or CLI: two different contracts
MCP is natural for an agent working conversationally. The model sees descriptions of available tools, chooses parameters and interprets the response. Its advantages are flexibility and a low integration threshold. The risk is greater interpretive freedom, particularly when the tool catalogue is large or its permissions broad.
A CLI offers a more traditional automation contract. A command, exit code and response schema can be tested, constrained by a wrapper and run in a pipeline. gcx supports contexts, so development, staging and production configurations do not need to share one target or token.
A useful rule is to match the interface to the risk:
- reading a dashboard during analysis may happen through MCP;
- bulk versioning of dashboards is better handled by a deterministic pipeline;
- changes to production alerts need review and approval regardless of interface;
- exploratory high-cost queries need limits on time, range and series count.
Telemetry as part of the task specification
The most interesting organisational change is to include observability in the definition of done. A task for an agent can specify not only unit tests but also:
- an allowed latency budget;
- a maximum increase in error rate;
- the required synthetic-test result;
- a ban on increasing metric cardinality;
- dashboards and alerts that must remain valid;
- a comparison window and minimum sample size.
The agent no longer merely “believes” it improved the system. It provides a patch, tests and an observation package. A human still decides whether the metric represents the real goal and whether the outcome justifies deployment.
This pattern fits naturally with a local OpenTelemetry environment and the LGTM stack. An agent can instrument a service, run it in isolation, generate controlled load and inspect logs, metrics and traces without reaching customer data. We explore the architecture in more depth in AI agent observability with OpenTelemetry.
The most important security risks
Telemetry is a privileged data source. Logs contain user identifiers, request fragments, hostnames, application errors and occasionally secrets that should never have been recorded. Dashboards and alert rules reveal architecture, critical services and response thresholds.
Agent access therefore needs several guardrails.
Read-only by default
An agent investigating a regression does not need the right to change an alert or delete a dashboard. Create a separate identity with the smallest possible scope and distinct contexts for each environment. Production should remain read-only unless a specific workflow justifies an exception.
Approval for state-changing operations
Changing an alert rule, data-source configuration or dashboard can blind incident detection. A write operation should produce a readable diff and require approval. Prefer a pull request and GitOps over direct mutation from an agent session.
Query cost controls
An imprecise query may retrieve a huge log range or create expensive cardinality. Limit time, data points and source scope. Keep the sandbox separate from production and label agent queries in audit logs.
Protecting data in model context
Redact secrets and personal data before a result reaches the model. Establish session retention, model provider and processing region. The Grafana token must not appear in prompts, repository files or conversation history.
A secure MCP server
An MCP server is a new trust boundary. Authenticate clients, limit exposed tools and validate parameters on the server rather than relying on model obedience. Our Model Context Protocol security guide provides a complete threat model.
An example safe workflow
Suppose an agent is asked to reduce response time in a payment service.
- It receives a read-only staging context and a limited dashboard set.
- It retrieves baseline telemetry and identifies a specific trace segment.
- It edits code on an isolated branch and adds a regression test.
- It runs k6 and local OpenTelemetry instrumentation.
- It compares the result with the recorded baseline.
- It opens a pull request containing code, evidence and uncertainty.
- A human approves a canary deployment.
- Separate automation observes the SLO and can roll back under a predefined rule.
The agent never receives permission to “fix” production autonomously. Telemetry gives it better evidence, not automatic authority to act.
Frequently asked questions
Does gcx replace the Grafana API?
No. It is an interface tailored to predictable agent and automation use, with structured output and contexts. The API remains the foundation for custom integrations.
Does Grafana MCP server work only with Grafana Cloud?
No. Teams can use the hosted option for Grafana Cloud or self-host the server.
Should an agent have access to production logs?
Only with a justified use case, minimum scope, data redaction and auditing. Many tasks can be completed in staging with realistic, anonymised load.
Does more telemetry automatically improve agent code?
No. The agent still needs meaningful measures, a baseline and success criteria. Bad or incomplete telemetry can produce conclusions as poor as having none.
Conclusion
The general availability of gcx and Grafana MCP server shows that observability is becoming an interface for AI agents rather than only a screen humans inspect after deployment. The greatest value will appear where telemetry acts as a measurable specification and permissions, cost and change history remain controlled. If you are deploying agents with access to business tools, include the whole workflow in an AI and LLM security audit.
Sources: Grafana Labs on telemetry-driven development with gcx and Grafana MCP, gcx documentation, Grafana AI Week 2026.